The Global Yoga Survey 2021
Yoga has been practiced in Hindu societies for thousands of years. Over the past two centuries, and especially over the past decades, the awareness of the benefits of yoga practice has expanded significantly. Now, it is practiced to some extent in almost every country in the world.
The Global Yoga Survey aims to provide data to yoga practitioners and organizations. Moreover, it aims to share insights on motivations that move people to practice yoga.
Share the Global Yoga Survey
You are welcome to share this survey or any of the graphics. When you do, please make sure to include the following link:
Preface
Despite the ubiquity of yoga globally, there are few studies that allow us to understand who and why people practice yoga.
Before carrying out our global survey, DoYou identified some studies that revealed data on yoga practice. DoYou gathered valuable data reported from 2016 Yoga in America Study conducted by Yoga Journal and Yoga Alliance; a systematic review of demographic, health-related, and psychosocial factors associated with yoga practice by Crystal L. Park, Tosca Braun, and Tamer Siegel published in the Journal of Behavioral Medicine in 2015; and a qualitative investigation of barriers and facilitators to yoga among predominantly racial/ethnic minority, low-income adults carried out by Christine E.Spadola and her research team in 2017.
We found that, while the data is extremely valuable, most of the data available is from the US and there is limited information on yoga practice on a global scale. Additionally, survey data from 2016 doesn’t reflect recent trends in participation in physical activity through digital platforms. The data, nonetheless, is interesting and useful for gauging who and how yoga is practiced in western societies. Data from the previously mentioned sources tell us that:
- There are estimated 36 million yoga practitioners in the US alone, which is an increase of 50% from 2012.
- Several studies suggest a fairly equitable distribution of people who practice yoga across the lifespan.
- While data is limited, in the west, there may be an association between income and yoga practice. In other words, it is possible that people with higher incomes are more likely to practice yoga.
- In the US, more women than men practice yoga; women represent about 72% of yoga practitioners and men represent 28%.
- Yoga is strongly linked with education; people in the US with higher levels of educational attainment are more likely to practice yoga.
- In general, yoga practice is associated with positive health behaviors.
There are limited studies that reveal the specifics of people’s yoga practice on a global scale.
The Global Yoga Survey obtained up-to-date information on yoga practice across the world in 2021.
Through The Global Yoga Survey, we gathered data from 10,982 respondents about:
- How often people practice yoga
- Reasons and motivations for practicing yoga
- Where people prefer to practice yoga
- Perceived benefits of practicing yoga
- The services that people use to assist them in their yoga practice
- Different habits integrated into yoga practice
And several other details about yoga practice in 2021.
Summary of Key Findings
- Friends and family have a significant influence in moving others to practice yoga.
- Two-thirds of yoga practitioners practice three or more times a week.
- Barriers to practicing yoga include perceived laziness, work, household and family reasons, and monetary reasons.
- More than 9 in 10 respondents consider themselves beginner or intermediate-level yoga practitioners.
- 8 in 10 yoga practitioners prefer to do yoga at the start or end of their day.
- 8 in 10 yoga practitioners do yoga for 30 minutes or more.
- Vinyasa Flow and Hatha Yoga are the most popular yoga styles.
- More than 8 in 10 yoga practitioners practice yoga at home using online, streamed, or television-based services.
- YouTube is the leading online service to guide yoga practice.
- Digital devices are the preferred mode for watching yoga videos.
- 3 in 4 yoga practitioners prefer to listen to music sometimes or always during their practice.
- Yoga practitioners perceive the benefits to both the mind and the body as very important.
- Flexibility, strength, and balance are perceived as the most important benefits of yoga to the body.
- Stress relief, relaxation, and focus are perceived as the most important benefits of yoga to the mind.
- Almost a third of people who practice yoga do so to help manage a specific medical issue.
- The teacher, the atmosphere, and the yoga style are the most important things people consider in choosing a yoga class.
- Other health habits many yoga practitioners participate in are meditation and a vegan or vegetarian diet.
- Open-mindedness and conscious living are the most-liked factors of the yoga community, while commercialization and ego are the least-liked factors of the yoga community.
- Equipment and clothing preferences among yoga practitioners vary significantly.
- Only a quarter of yoga practitioners go to events, but half would like to.
- There are a wide range of yoga-related spending behaviors but a significant proportion spends up to US$ 50 monthly.
- 1 in 5 people have experienced a yoga-related injury.
- Over 1 in 10 yoga practitioners are currently yoga teachers and 1 in 4 yoga practitioners want to become yoga teachers.
- 6 in 10 yoga teachers are registered with a yoga association, Yoga Alliance being the most popular.
Detailed Key Findings of The Global Yoga Survey
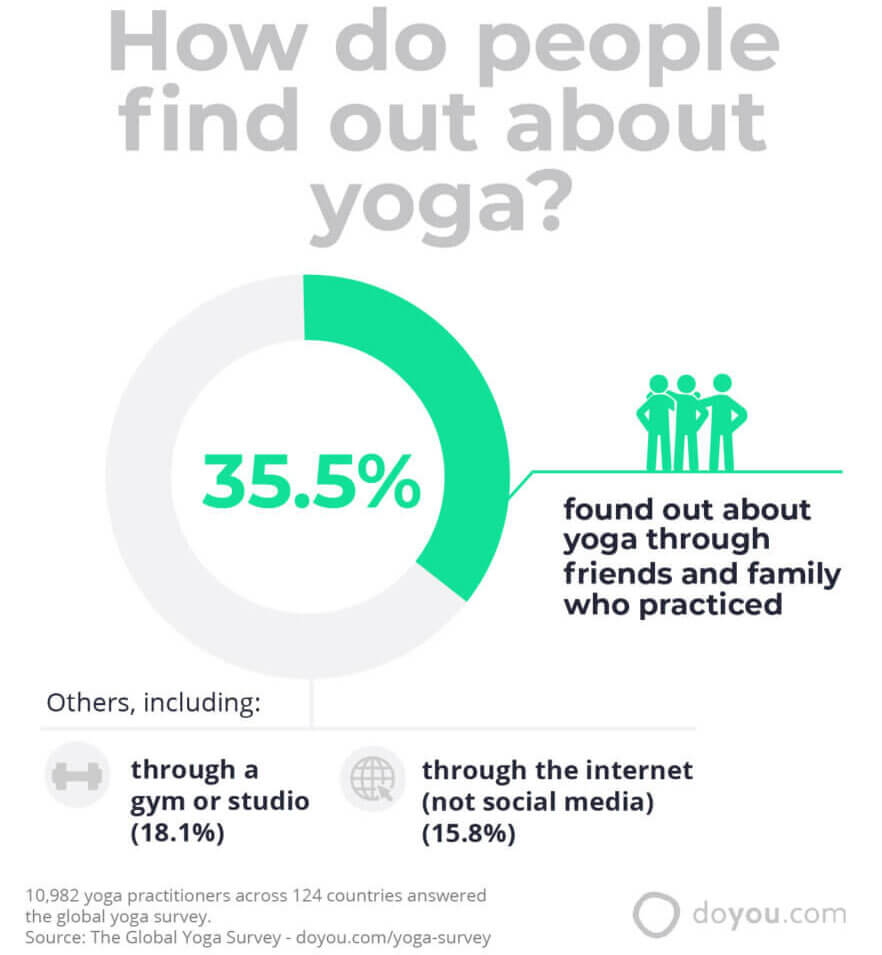
Key Finding #1: Friends and Family Have a Significant Influence in Moving Others to Practice Yoga
35.5% of respondents found out about yoga through friends and family who practiced. This sheds light on the role that social groups play in influencing others to learn about new practices. Since this question separated “through friends and family who practice” from “through social media”, this demonstrates how physical interactions with social connections continue to play a vital role in spreading the word about yoga.
The next most popular responses to this question were, “through a gym or studio”, and “through the internet (not social media)”.
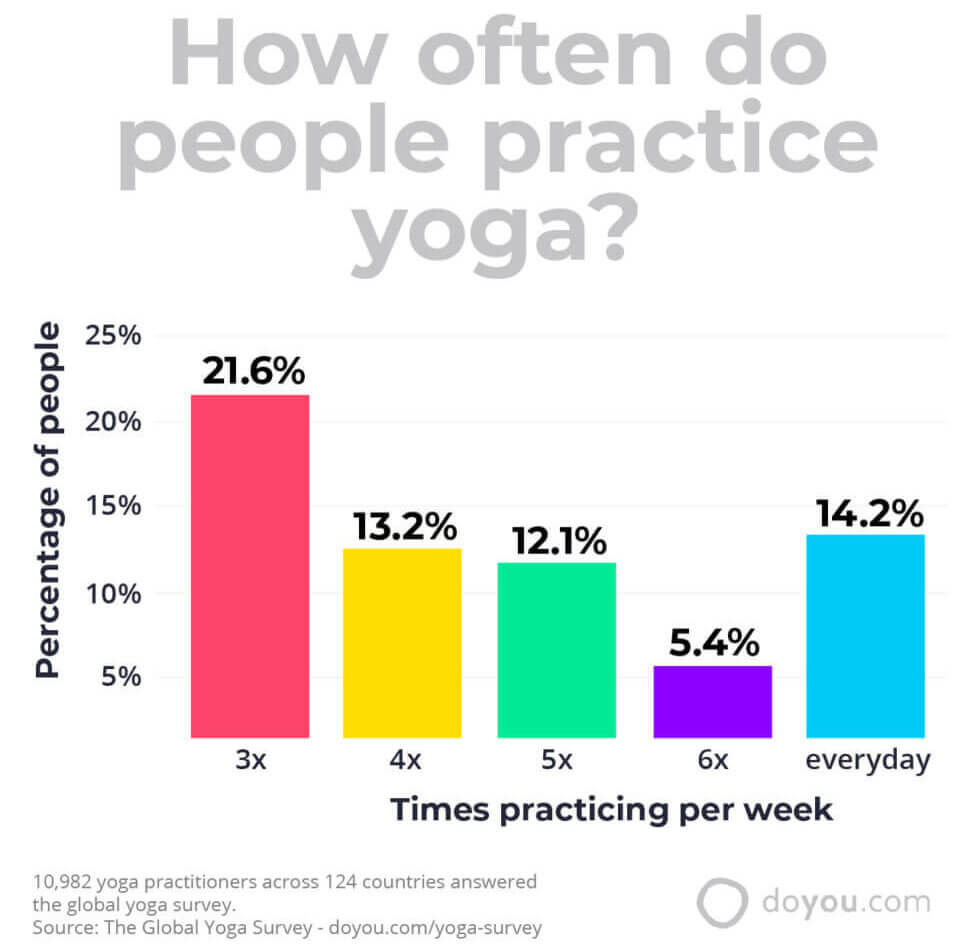
Key Finding #2: Two-Thirds of Yoga Practitioners Practice 3 or More Times a Week
When people decide to practice yoga, the majority adopt the practice and implement it into their regular weekly schedules.
21.6% of respondents reported practicing three times a week, 13.2% of respondents reported practicing four times a week, 12.1% of respondents reported practicing five times a week, 5.4% of respondents reported practicing six times a week, and 14.2% of respondents practiced yoga every day. Together, these add up to 66.5% of yoga practitioners who practice three or more times a week.
Additionally, 5.8% of yoga practitioners practiced less than once a week, 9.6% practiced once a week, and 18% practiced twice a week.
The data suggests that most yoga practitioners find a way to add yoga into their regular fitness and wellness plans. Several factors specific to the nature of yoga may influence respondents’ desire to practice yoga multiple times a week. These include the ability to practice at different skill and fitness levels, requirement of using little to no equipment, and regular practices translates into benefits for practitioners in the short term.
Key Finding #3: Barriers to Practicing Yoga Include Perceived Laziness, Work, Household and Family Reasons, and Monetary Reasons
80% of respondents expressed a desire to want to practice more than they do. The barriers to practicing as much as they would like were:
- Laziness, procrastination, and distraction (44%)
- Work (41.2%)
- Household and family reasons (24.9%)
- Money (18.2)
- Other reasons (10.1%)
Note that respondents were permitted to check more than one option, so the percentage reflects the proportion of the respondents who consider any of those options to be true.
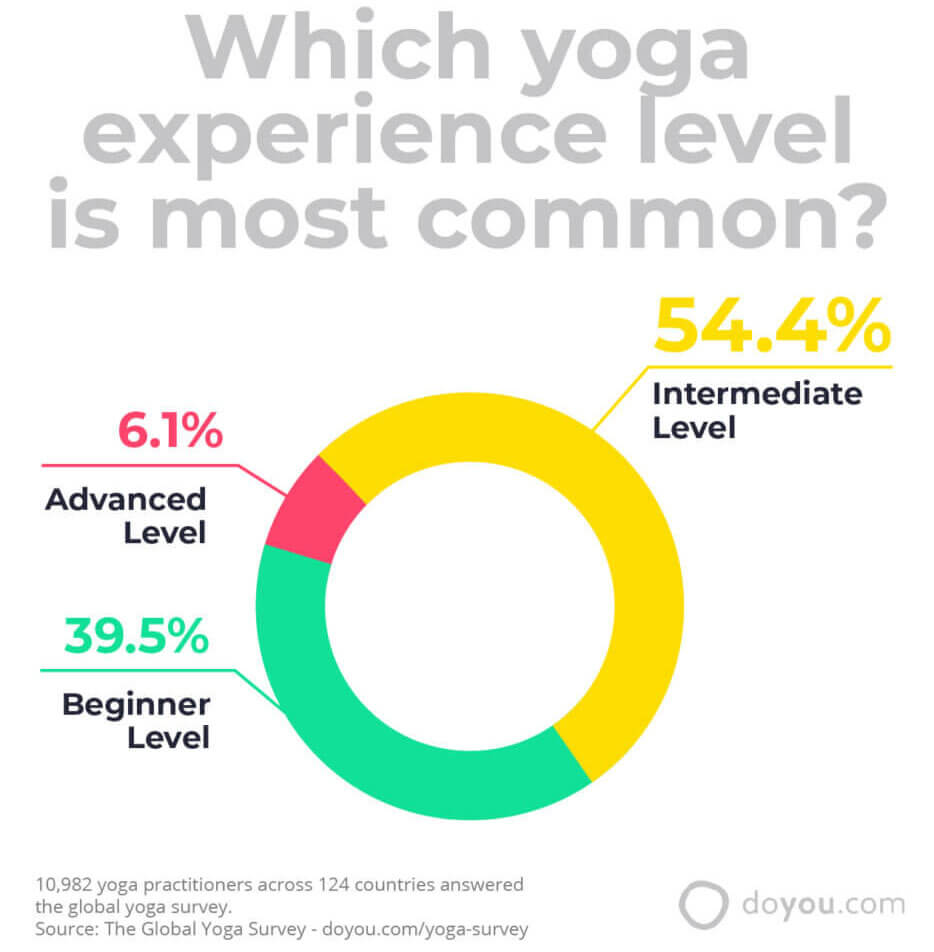
Key Finding #4: More than 9 in 10 Respondents of the Yoga Survey Consider Themselves Beginner or Intermediate-Level Yoga Practitioners
93.9% of respondents considered themselves to be beginner or intermediate-level practitioners. Those who are beginners are likely just starting out practicing yoga, while those who considered themselves to be intermediate level have been practicing yoga regularly for several months or years.
The detailed breakdown of data is as follows:
- 39.5% reported being at a beginner level
- 54.4% reported being at an intermediate level
- 6.1% reported being at an advanced level 6.1%
Advanced yoga practitioners have likely been regularly practicing yoga for decades or have obtained their instructor’s certificate.
Key Finding #5: 8 in 10 Yoga Practitioners Prefer to Do Yoga at the Start or End of Their Day
One of the survey questions asked about the preferred time of day that respondents carried out their yoga practice.
The options were:
- Usually in the morning
- Usually in the day
- Usually in the evening
- When I can squeeze it in
40.5% of yoga practitioners perform yoga in the morning, while almost the same proportion (42.2%) performs yoga at the end of the day.
30.2% of practitioners perform yoga at irregular times.
About half (52.9%) of respondents practice yoga at these times because it’s the most convenient for them. Meanwhile, 40.2% of respondents choose those times because it is when they prefer to carry out their practice.
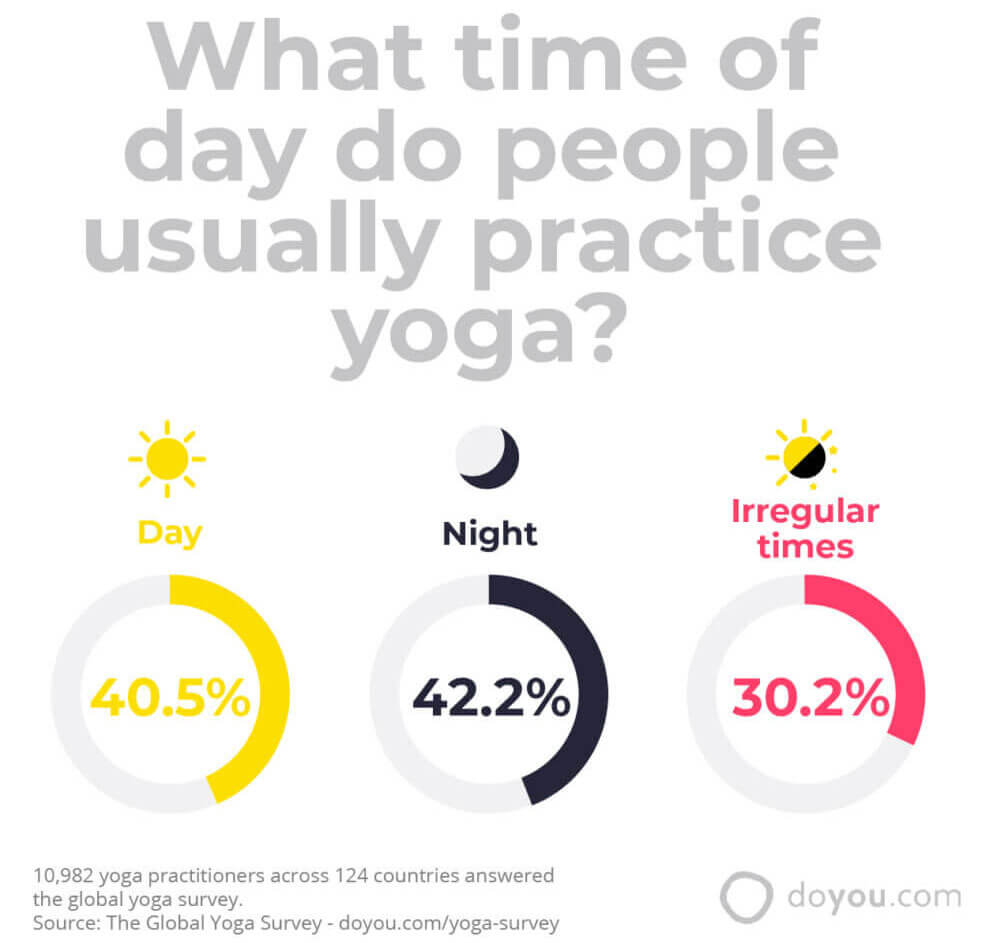
Note that respondents were permitted to check more than one option, so the percentage reflects the proportion of the respondents who consider any of those options to be true. For example, a respondent who does yoga twice a day may check off that they usually do yoga in the morning and in the evening.
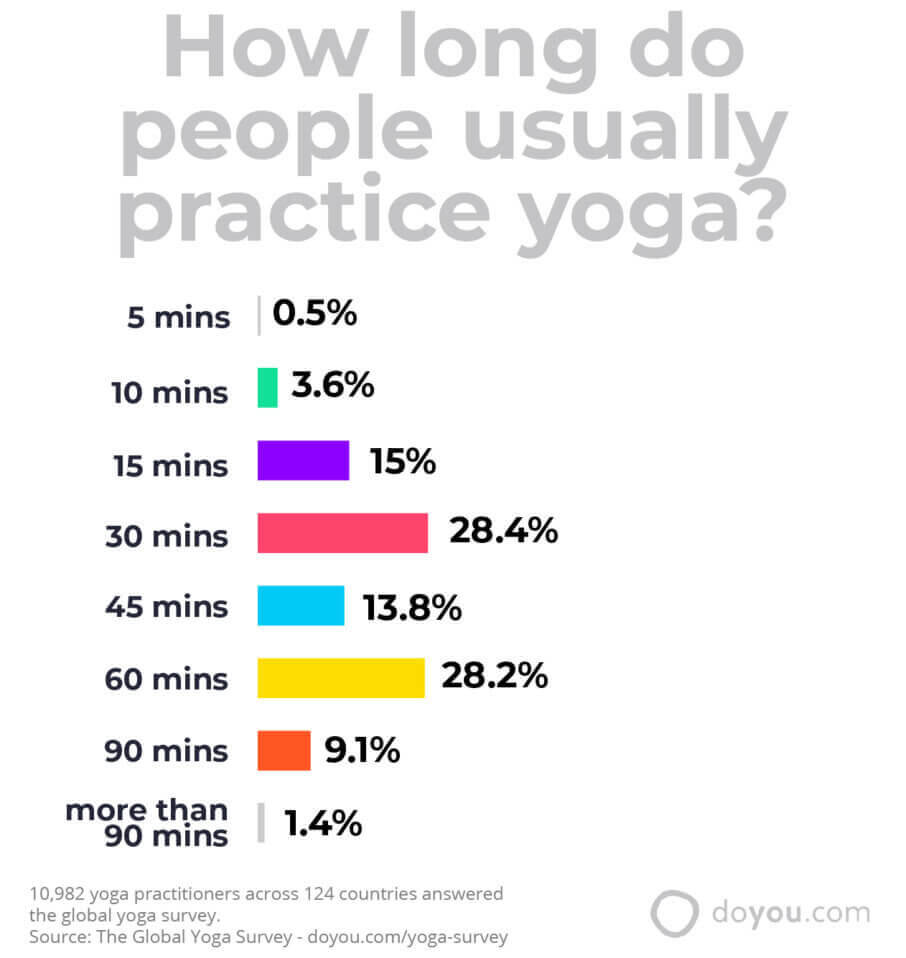
Key Finding #6: 8 in 10 Yoga Practitioners Do Yoga for 30 Minutes or More
The most common time intervals for yoga practice were 30 minutes (28.4%) and 60 minutes (28.2%). Still, 19.1% of yoga practitioners do yoga for only 15 minutes or less, and 10.5% do yoga for 90 minutes or more each session.
The complete breakdown of data is as follows:
- About 5 minutes – 0.5%
- About 10 minutes – 3.6%
- About 15 minutes – 15%
- About 30 minutes – 28.4%
- About 45 minutes – 13.8%
- About 60 minutes – 28.2%
- About 90 minutes – 9.1%
- More than 90 minutes – 1.4%
Share the Global Yoga Survey
You are welcome to share this survey or any of the graphics. When you do, please make sure to include the following link:
Key Finding #7: Vinyasa Flow and Hatha Yoga Are the Most Popular Yoga Styles
Respondents were asked about the main styles of yoga they practice. In order of popularity, they responded:
- Vinyasa Flow (57.3%)
- Hatha (42.1%)
- Restorative (29.6%)
- Power Yoga (29.4%)
- Ashtanga (25.3%)
- Yin (17.2%)
- Hot Yoga (9.6%)
- Iyengar (8.5%)
- Kundalani (5.3%)
- Anusara (2.6%)
- Sivananda (2.5%)
- Acro (2.1%)
- Aerial (2%)
- Kripalu (1.6%)
- Jivamukti (1.5%)
Note that respondents were permitted to check more than one option, so the percentage reflects the proportion of the respondents who practice that yoga style for any session of their regular yoga practice.
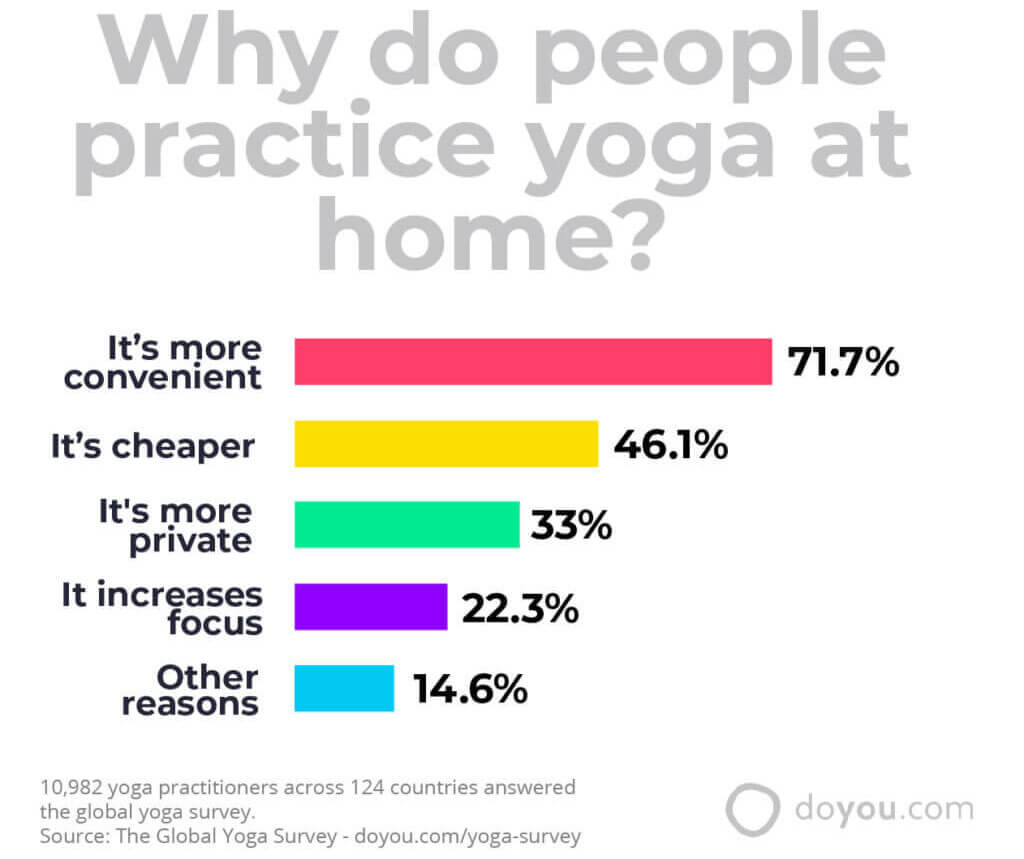
Key Finding #8: More than 8 in 10 Yoga Practitioners Practice Yoga at Home Using Online, Streamed, or Television-Based Services
85% of yoga practitioners practiced yoga at home for at least some of their practices. Below are the primary reasons people perform yoga at home, in order of popularity:
- It’s more convenient (71.7%)
- It’s cheaper (46.1%)
- I prefer the privacy (33%)
- I feel more focused (22.3%)
- Others (14.6%)
From this we can extract that convenience, value, and privacy are three reasons people choose to practice yoga at home over other locations.
At home, 79.6% used an online, streaming, or TV-based service for their yoga practice.
This data reflects recent trends in yoga practice, as well as the influence of the COVID-19 pandemic on the location of fitness activities.
Still, 41.3% of respondents do yoga at a studio. Only 22.2% do yoga at the gym or somewhere else.
Note that respondents were permitted to check more than one option, so the percentage reflects the proportion of the respondents who practice yoga at home for one or several reasons.
Key Finding #9: YouTube is the Leading Online Service to Guide Yoga Practice
Respondents who used online services were asked whether YouTube, other free services, or other paid services were used to guide their yoga practice.
78.1% of respondents reported using YouTube, while 43.6% used other free services, and 27.7% used other paid services. This data indicates that while the average user will search for guided yoga on YouTube, most of them also utilize another free service or paid service.
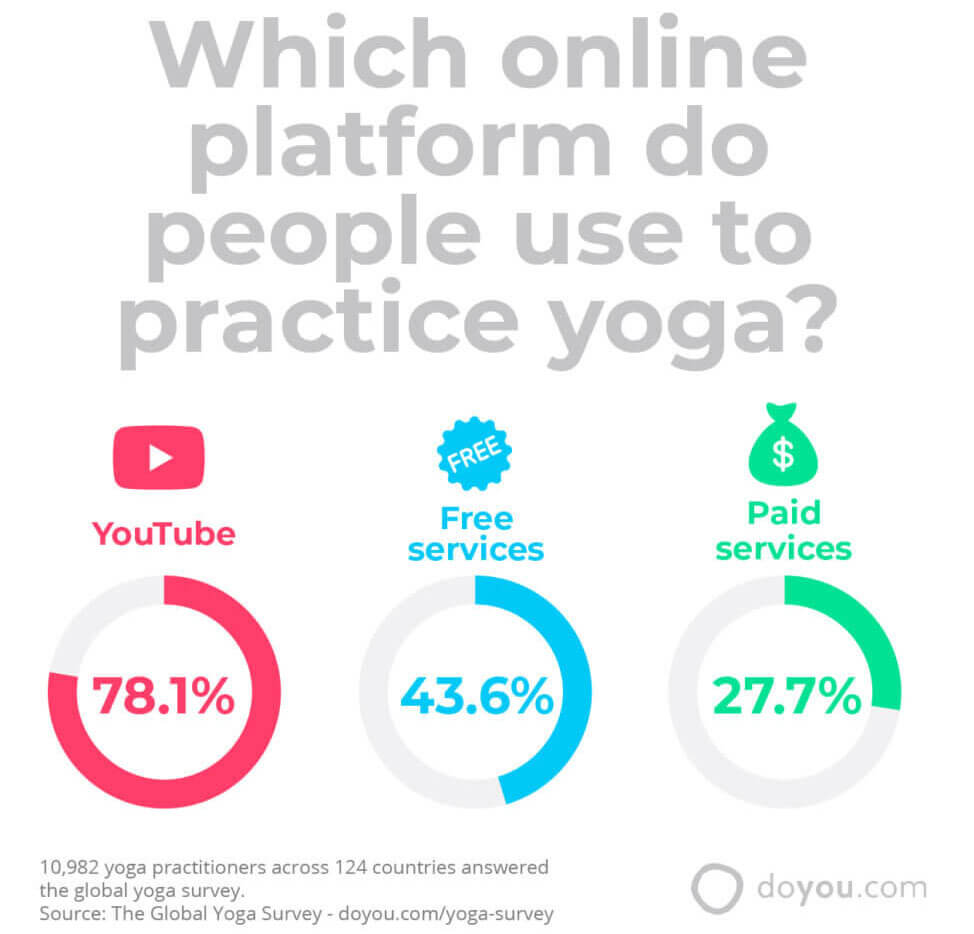
Note that respondents were permitted to check more than one option, so the percentage reflects the proportion of the respondents who practice yoga using that platform during any of their yoga sessions. For example, a person may use Youtube and paid services to guide their yoga sessions.
Key Finding #10: Digital Devices Are the Preferred Mode for Watching Yoga Videos
The digital era has made way for service and entertainment access through portable devices. This worldwide trend is reflected in how people watch yoga videos and media.
Three-fourths (75.6%) of yoga practitioners watch videos on their computer or laptop, 36.6% watch yoga videos on their tablet, and 33.5% watch yoga videos on their phone.
Even though many modern TVs have integrated streaming technology, only 24.8% watch Yoga Videos on their TV.
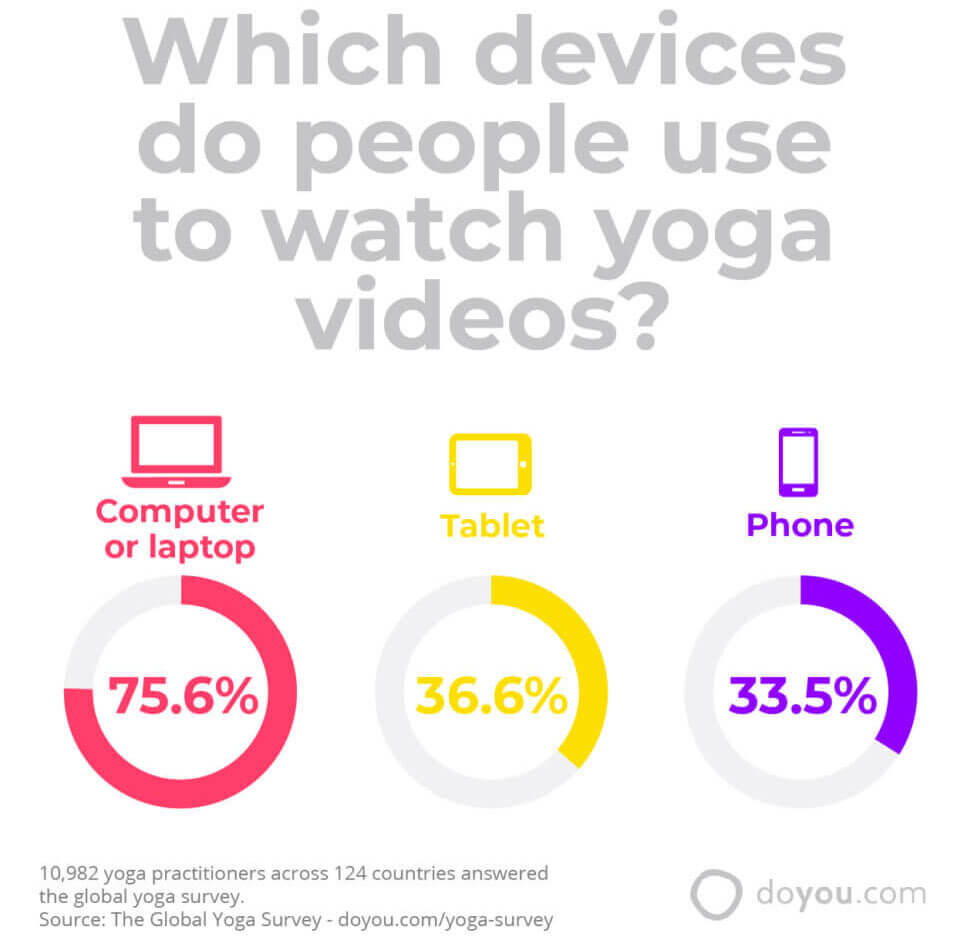
Note that respondents were permitted to check more than one option, so the percentage reflects the proportion of the respondents who practice yoga using any of those devices. For example, a person may use their phone and their laptop to watch yoga videos, so they chose both options. This question reflects high rates of multiplicity, meaning that people tend to use more than one digital platform to watch yoga videos.
Key Finding #11: 3 in 4 Yoga Practitioners Prefer to Listen to Music Sometimes or Always During Their Practice
36.9% of yoga practitioners always listen to music during their practice. Meanwhile, 39.2% listen to music sometimes during their practice. This adds up to 76% of people who listen to music while they practice yoga.
For most people, the type of music is important for setting the tone and creating an environment apt for a successful yoga practice. The most popular genres people listen to during their yoga practice are:
- Meditation music (69.8%)
- Traditional Indian/Devotional music (35.9%)
- Indie/Alternative music (26.3%)
- Classical music (15.2%)
- Pop (9.3%)
- Folk (8.7%)
- R&B/Soul (8.3%)
- Electronic (7.5%)
- Reggae (7.2%)
- Jazz (7.1%)
- Rock (6.7%)
- Dance/EDM (5.8%)
- Blues (4.4%)
- Hip Hop/Rap (3.6%)
- Drum & Bass (2.9%)
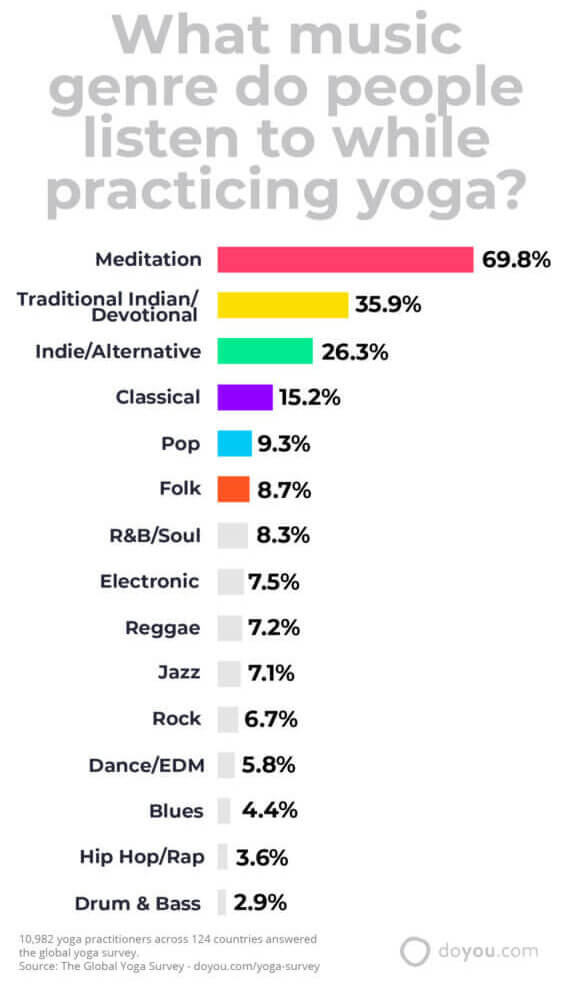
Note that respondents were permitted to check more than one option regarding music styles, so the percentage reflects the proportion of the respondents who practice yoga while listening to any of those styles of music.
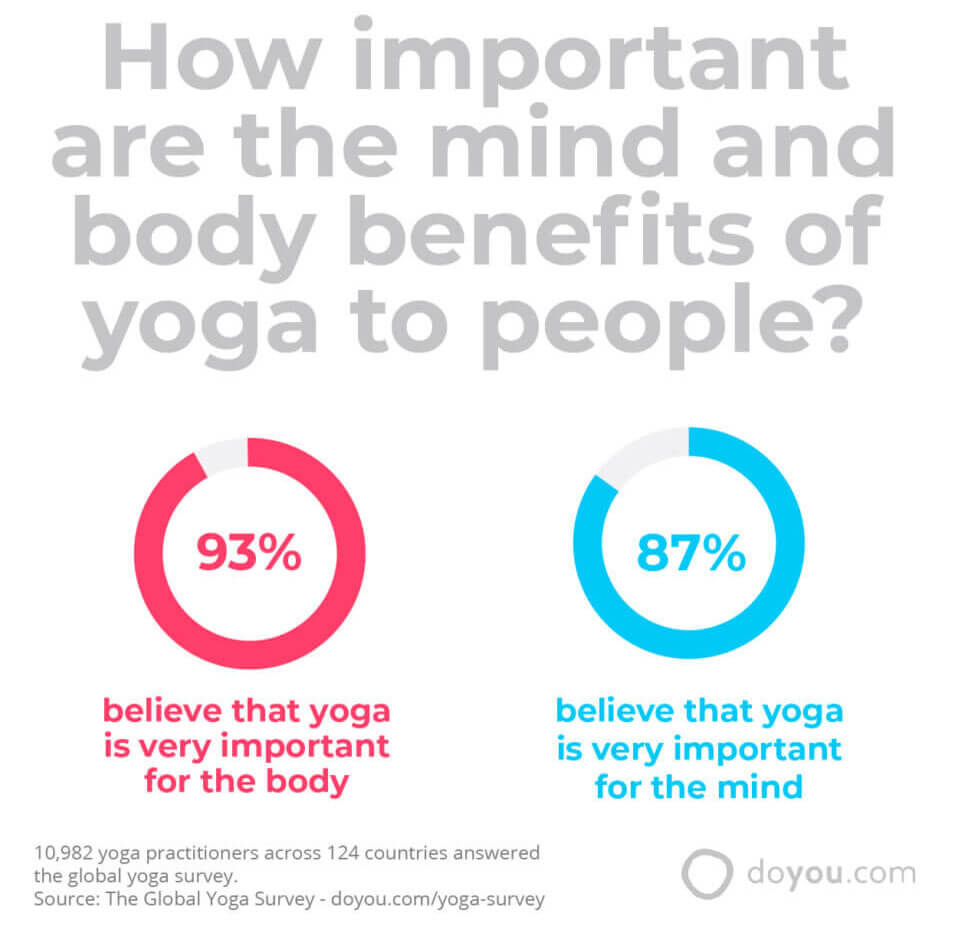
Key Finding #12: Yoga Practitioners Perceive the Benefits to Both the Mind and the Body as Very Important
93% of yoga practitioners believe that yoga’s benefits for the body are very important. A significant percentage of people also believe that yoga’s benefits for the mind are very important, with an 87% response rate.
In both cases, less than 1% of respondents believed that the benefits to the mind or the body were not at all important.
Key Finding #13: Flexibility, Strength, and Balance Are Perceived as the Most Important Benefits of Yoga to the Body
Respondents were given several options to choose from to decide what yoga’s biggest benefits for the body are. The options were strength, balance, flexibility, weight loss, chronic pain relief, and other reasons. Respondents were permitted to check off more than one box.
The benefits perceived as most important to the respondents were:
- Flexibility (85.9%)
- Strength (79.9%)
- Balance (71.1%)
Chronic pain relief and weight loss were significantly less popular as reasons for doing yoga at 34.4% and 29.4% respectively, and only 4.8% had other bodily benefits in mind.
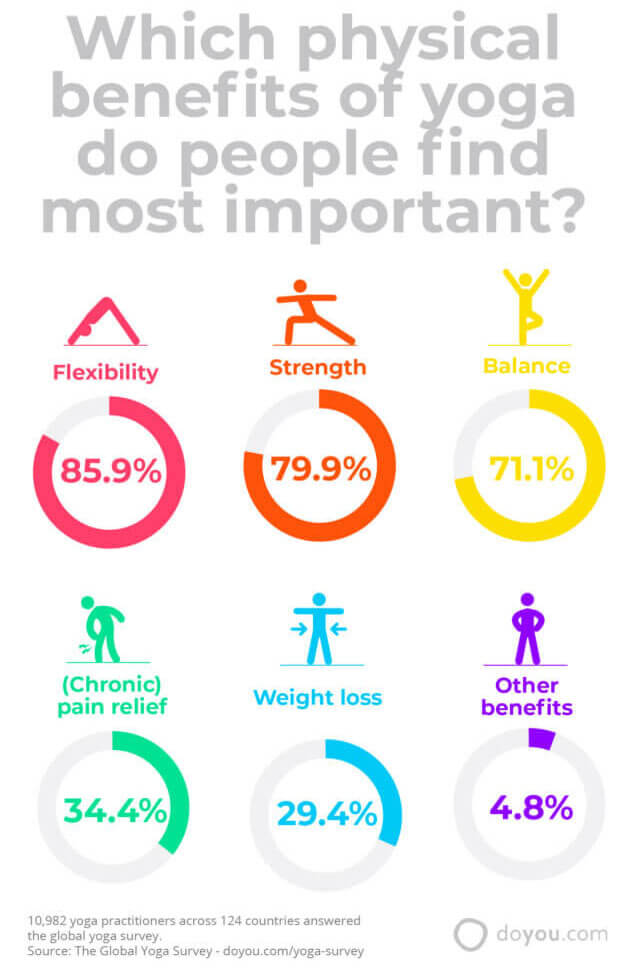
Note that respondents were permitted to check more than one option, so the percentage reflects the proportion of the respondents who perceive any of those benefits to be most significant, which, in some cases, may be multiple. For example, a person may feel that the greatest benefits are chronic pain relief, flexibility, and balance, so they would check all three options.
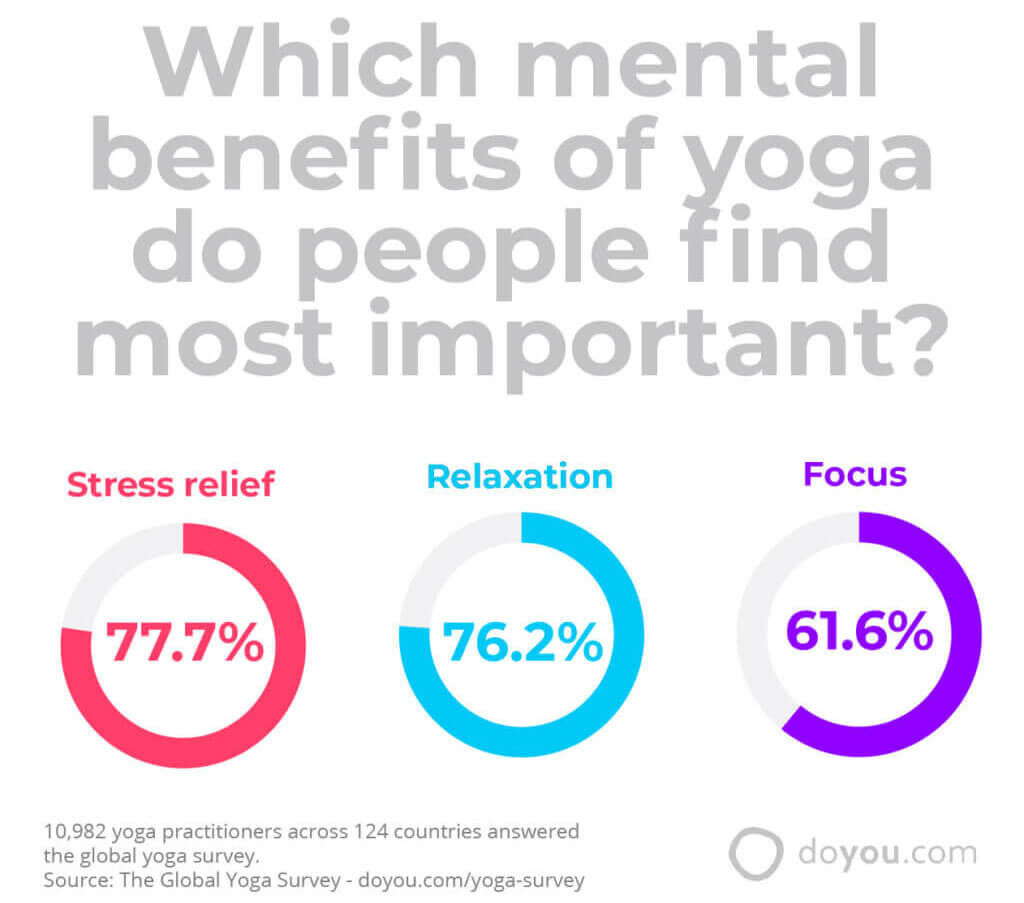
Key Finding #14: Stress Relief, Relaxation, and Focus Are Perceived as the Most Important Benefits of Yoga to the Mind
All three of the benefits users were prompted to select (stress relief, relaxation, focus) were perceived as important. In order of popularity, the responses that were perceived as most important were:
- Stress relief (77.7%)
- Relaxation (76.2%)
- Focus (61.6%)
Only 6.1% of yoga practitioners felt that there were other benefits to the mind that were more important to them than those listed.
Note that respondents were permitted to check more than one option, so the percentage reflects the proportion of the respondents who perceive those to be benefits of the mind. For example, they may perceive all three to be benefits to the mind, so would check all three.
Share the Global Yoga Survey
https://www.doyou.com/yoga-survey/
You are welcome to share this survey or any of the graphics. When you do, please make sure to include the following link:
Key Finding #15: Almost A Third of People Who Practice Yoga Do So to Help Manage a Specific Medical Issue
31.9% of people who practice yoga turn to yoga as a therapy to help manage specific health issues. Of those people, both physical and psychological health issues were disclosed as the reason they’ve turned to yoga. These, in order of popularity, include:
- Anxiety (55.2%)
- Back pain (49.8%)
- Depression (38%)
- Other health issues (27.5%)
- Neck pain (26.1%)
- Arthritis (11.7%)
- Scoliosis (9.2%)
- Post-traumatic stress disorder (PTSD) (5.4%)
1.5% preferred not to say which health issues they’ve sought out yoga for.
Note that respondents were permitted to check more than one option, so the percentage reflects the proportion of the respondents who consider any of those options to be true.

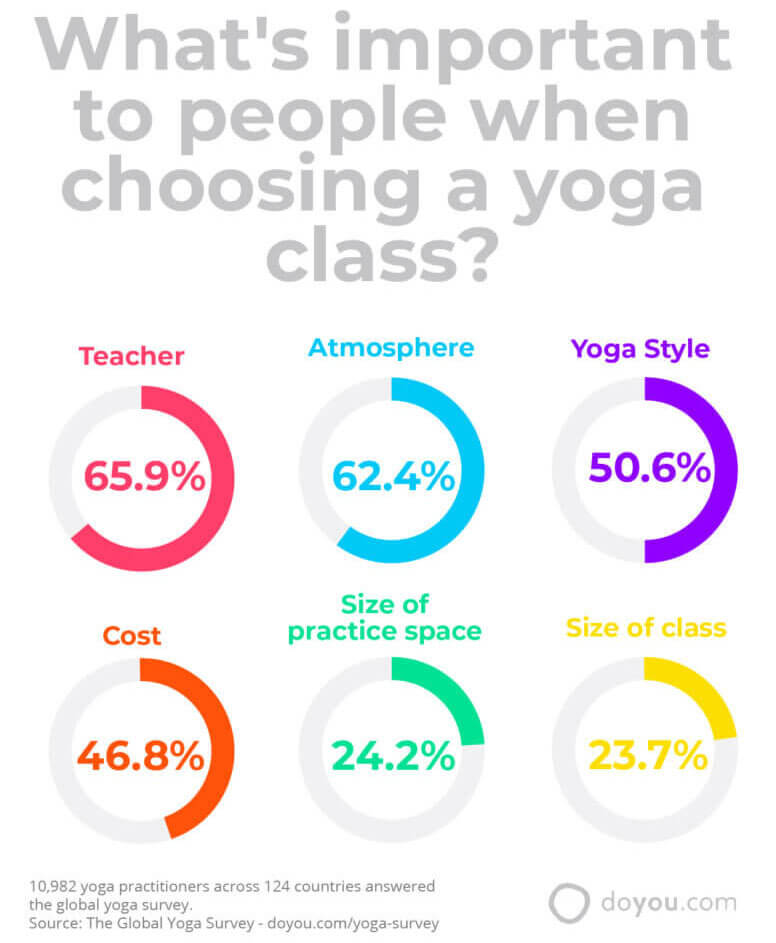
Key Finding #16: The Teacher, The Atmosphere, and the Yoga Style Are the Most Important Things People Consider When People Choose a Yoga Class
With so many options to choose from, there are multiple factors that may determine why a person chooses one yoga class over another.
Respondents of the global yoga survey identified that the factors most important to them were the teacher (65.9%), the atmosphere (62.4%), and the yoga style (50.6%).
In fact, the yoga teacher plays an important role in class selection and in the student’s desire to continue in the class. Of the 1309 people who have ever quit a yoga class, 30.2% quit due to the perceived incompetence of the teacher.
A factor that was equally divided between very important and kind of important, at 46.8% and 46.3% respectively, was the cost. Money, indeed, was a limiting factor for 18.2% of people who would like to practice yoga more often than they currently do.
Other factors that the survey inquired about were the cost, the size of the practice space, and the size of the class.
Regarding the cost, 46.8% reported that the cost was very important, 46.3% reported that it was kind of important, and 6.9% reported it was not important at all.
When asked about the size of the practice space, 24.2% reported it was very important, 51.3% reported it was kind of important, and 24.5% reported it was not important at all.
Finally, the size of the class (as in number of students) seemed to be of least importance overall: 23.7% reported it was very important, 47.9% reported it was kind of important, and 28.3% reported it was not important at all.
Note that respondents were permitted to check more than one option, so the percentage reflects the proportion of the respondents who feel that one or more of the listed elements are important when considering a yoga class.
Key Finding #17: Other Health Habits Many Yoga Practitioners Participate in are Meditation and a Vegan or Vegetarian Diet
76.4% of yoga practitioners also practiced meditation, and 98% of them did so in sessions of 30 minutes or less.
Additionally, 20% of respondents were vegan or vegetarian all the time, and another 21.3% were vegan or vegetarian sometimes. These figures are significantly greater than the estimated percentage of the US population that is vegan or vegetarian, which is currently at about 8%.
Note that respondents were permitted to check more than one option, so the percentage reflects the proportion of the respondents who consider any of those options to be true.
Moreover, 26.8% of respondents said they followed their diet for reasons connected to their yoga practice.
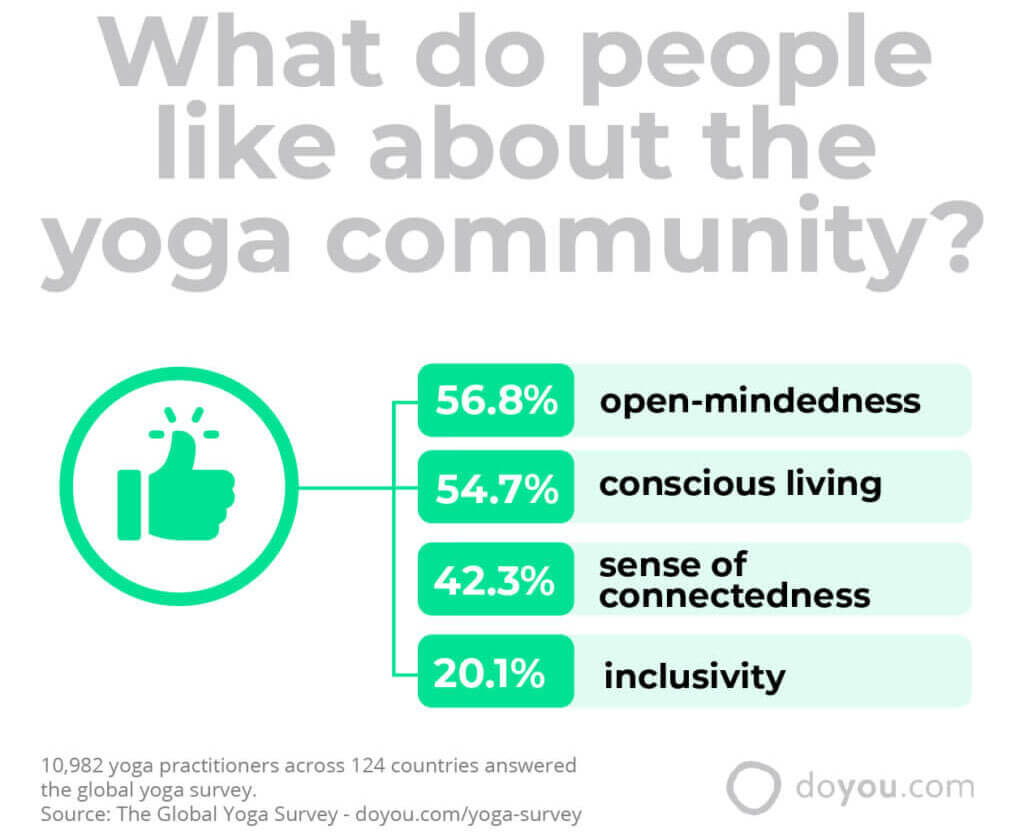
Key Finding #18: Open-Mindedness and Conscious Living Are the Most-Liked Factors of the Yoga Community, While Commercialization and Ego Are the Least-Liked Factors of the Yoga Community
When asked what respondents most liked about the yoga community, open-mindedness and conscious living were most selected, at 56.8% and 54.7%, respectively. A sense of connectedness followed in close third with 42.3% and inclusivity with 20.1%
When asked what they did not like about the yoga community, 43% of respondents said they were happy with the current state of the yoga community and there was nothing they disliked. Of those who did identify things they did not like about the yoga community, the most frequently selected reasons were commercialization and ego at 31.4% and 26.1%, respectively. Excessive competitiveness followed closely with 22.6% and sense of entitlement with 13%.
Note that respondents were permitted to check more than one option, so the percentage reflects the proportion of the respondents who perceive the most-liked or least-like factors to be true. In several cases, respondents checked more than one box.
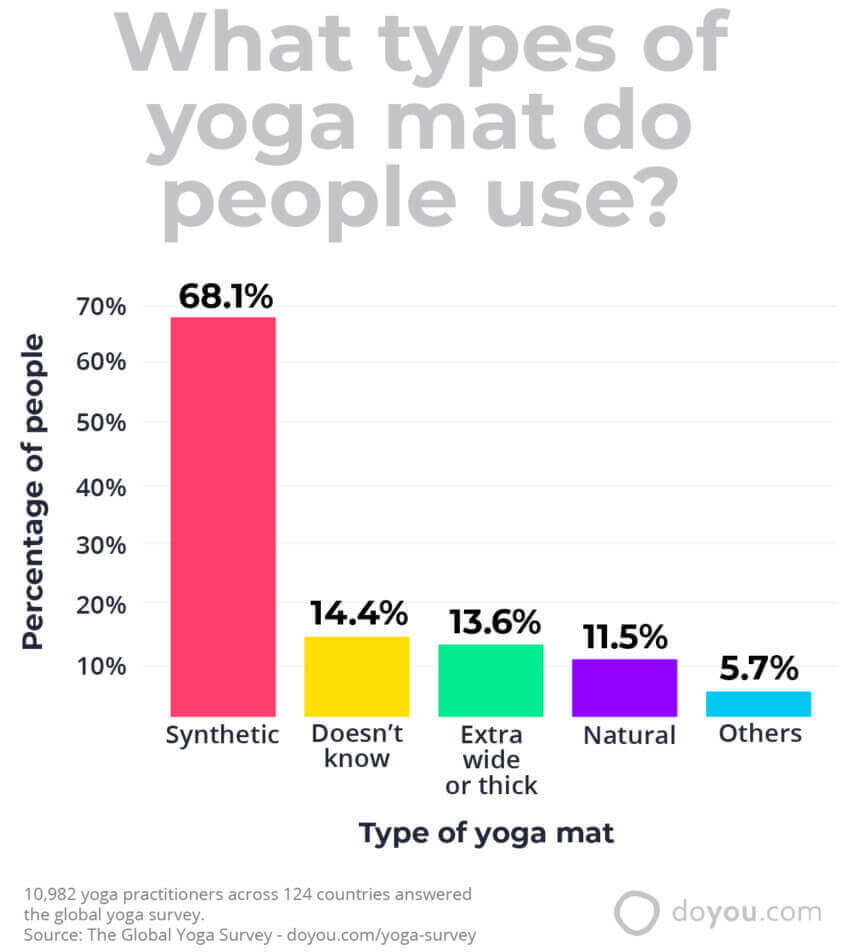
Key Finding #19: Equipment and Clothing Preferences Among Yoga Practitioners Vary Significantly
From mat material to prop usage and clothing, there are a wide variety of preferences.
Below is a summary of the mat preferences. The data reflects respondents who use those mats, and they could select multiple options:
- 68.1% synthetic (PVC, TPE, rubber)
- 13.6% extra wide or thick
- 11.5% natural (hemp, jute, cork, etc.)
- 5.7% other materials
- 14.4% doesn’t know
The mat preferences reflect market availability of yoga mats made of different materials and end-user prices. In general, standard synthetic mats are of lower prices and they are more widely available. However, specialty mats and mats made of natural materials will likely see growth in terms of demand and supply in the market in the years to come.
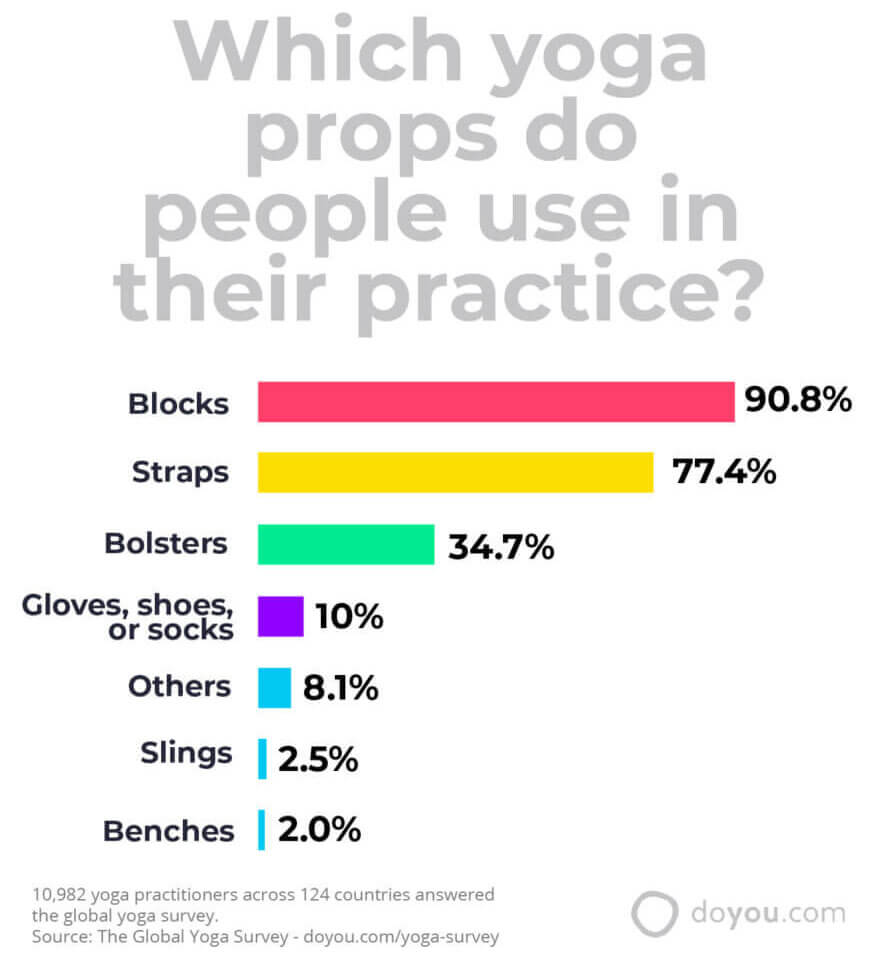
66.4% of people use props during their yoga practice. Prop usage among those who do use props is summarized as follows:
- Blocks (90.8%)
- Straps (77.4%)
- Bolsters (34.7)
- Gloves, shoes, or socks (10%)
- Slings (2.5%)
- Benches (2.0%)
- Others (8.1%)
The data reflects respondents who use those props, and they could select multiple options.
The use of props reflects the preferred yoga style, as well as the level of experience of yoga practitioners. Those who are beginners or intermediate may find props useful in supporting them as they gain flexibility and balance.
There are no strong trends regarding preferred tops to practice. Top usage during yoga practice is summarized as follows:
- Tight tank (33.4%)
- Sports bra (26.5%)
- Loose t-shirt (22.6%)
- Loose tank (17.7%)
- Depends (16.8%)
- Doesn’t care (10.1%)
- Others (4.1%)
Note that respondents were permitted to check more than one option, so the percentage reflects the proportion of the respondents who consider any of those options to be true.
Regarding yoga pants preferences, only 21.7% have found the perfect pair, and 26.2% have found a pair they like, but have identified room for improvement. 16.1% has not found the perfect pair. The factors that have gotten in the way of finding the perfect pair are:
- Imperfect fit (40.2%)
- Too expensive (32.8%)
- Not made of the right materials (22%)
- Imperfect quality (18.9%)
- Others (11.8%)
Of the total number of respondents, 36% said they don’t really care about the perfect fitting yoga pants.
What is important to note is that 51.3% of people spend between US$ 0.01 and US$ 50.00 per month on yoga equipment, and 8.7% spend more than US$ 50.00 monthly on equipment. That demonstrates an opportunity for yoga practitioners to try out new commercial trends in yoga accessories and equipment.
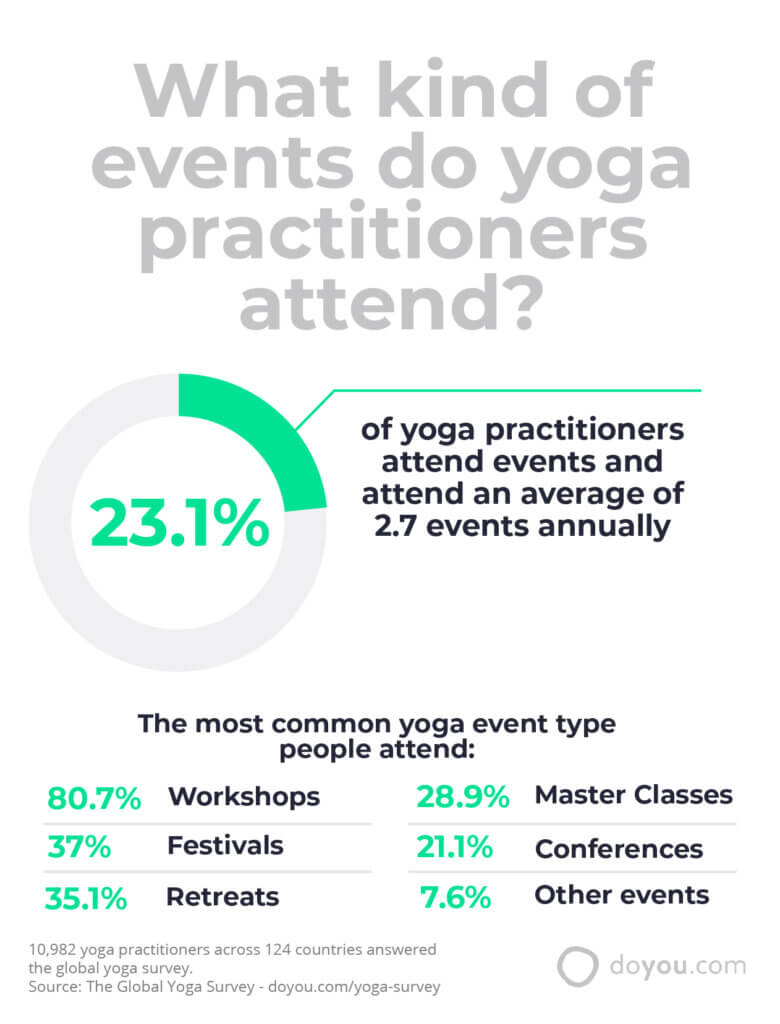
Key Finding #20: Only a Quarter of Yoga Practitioners Go to Events, But Half Would Like To
Yoga-related events include workshops, conferences, festivals, retreats, and masterclasses among others. 23.1% of yoga practitioners report regularly going to events, while a slightly bigger proportion, 26.9%, reported not attending events.
Exactly 50% of yoga practitioners, however, report not currently attending events but having a desire to do so.
Of the 23.1% of yoga practitioners that attend events, they attend an average of 2.7 events annually. The most common yoga event type people attend is workshops (80.7%), followed by festivals (37%), retreats (35.1%), master classes (28.9%), and conferences (21.1%). 7.6% of people who attend yoga events attend other types of events. Note that they were able to choose multiple selections, which is why the percentage does not add up to 100.
Disclaimer: The survey was carried out during the COVID-19 pandemic when many public events were limited or cancelled worldwide. It is likely that the numbers reported here were impacted by the pandemic.
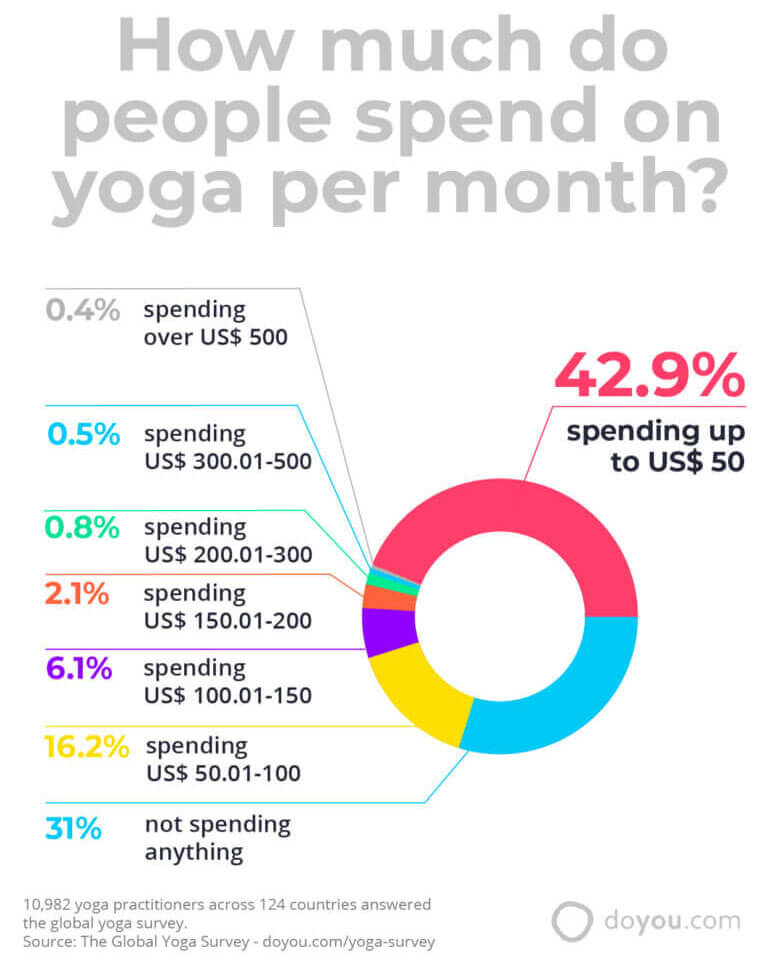
Key Finding #21: There Are A Wide Range of Yoga-Related Spending Behaviors, But Significant Proportion Spends up to US$ 50 Monthly
The global yoga survey included a question focused on capturing how much yoga practitioners spend a month on yoga practice including classes, online courses and videos, and retreats and events.
There is a significant range of spending behaviors of yoga practitioners:
- 42.9% reported spending up to US$ 50 monthly
- 31.0% reported not spending anything (US$ 0)
- 16.2% reported spending between US$ 50.01- US$ 100 monthly
- 6.1% reported spending between US$ 100.01 and US$ 150 monthly
- 2.1% spend over US$ 150.01 and US$ 200 monthly
- 0.8% report spending between US$ 200.01 and US$ 300 monthly
- 0.5% report spending between US$ 300.01 and US$ 500 monthly
- 0.4% report spending over US$ 500 monthly
The range of spending behaviors sheds light on the diverse nature of the yoga market. It is entirely possible to practice yoga without spending anything, using free tools and resources available online and in communities. It is also possible to spend hundreds of dollars for access to yoga classes, events, and premium services.
Share the Global Yoga Survey
https://www.doyou.com/yoga-survey/
You are welcome to share this survey or any of the graphics. When you do, please make sure to include the following link:
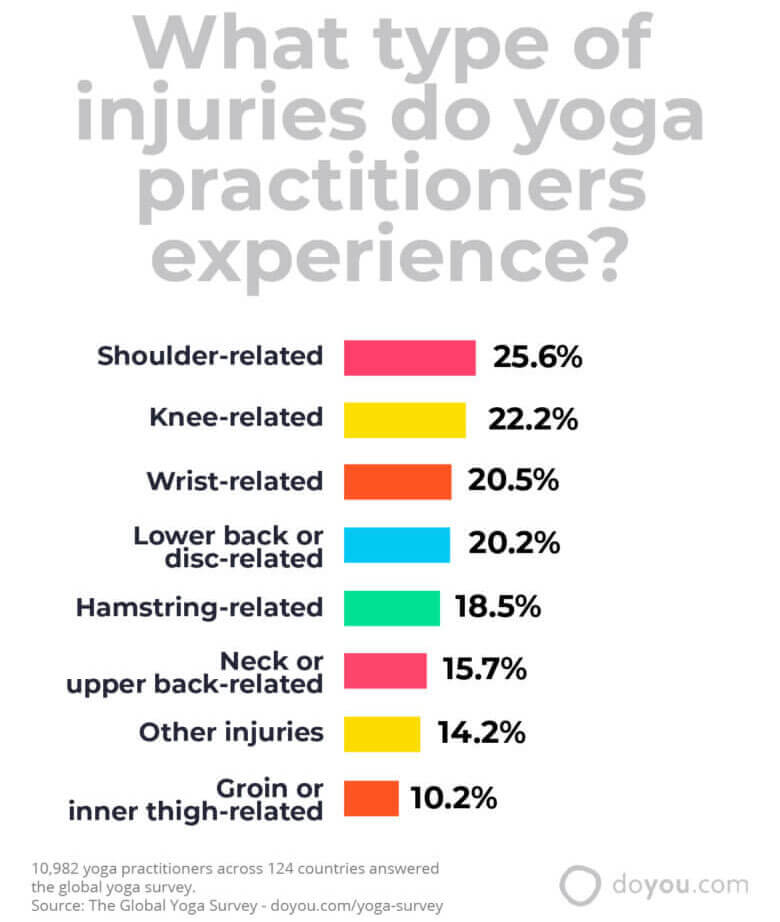
Key Finding #22: 1 in 5 people have experienced a yoga-related injury
21.6% of respondents reported that they have experienced a yoga-related injury. Of those that have had injuries, there was no specific type of injury that stood out over others.
The full survey results on yoga-related injuries in order of most to least proportion of respondents are as follows:
- 25.6% had experienced shoulder-related injuries
- 22.2% had experience knee-related injuries
- 20.5% had experienced wrist-related injuries
- 20.2% had experienced lower back or disc-related injuries
- 18.5% had experienced hamstring-related injuries
- 15.7% had experience neck or upper-back related injuries
- 14.2% had experienced other injuries not listed
- 10.2% had experienced groin or inner thigh-related injuries
Note that respondents could select multiple options, so it a person could have experienced multiple different injuries on separate occasions and had selected several options. The data above reflects how common the different yoga-related injuries are in those who had experienced them.
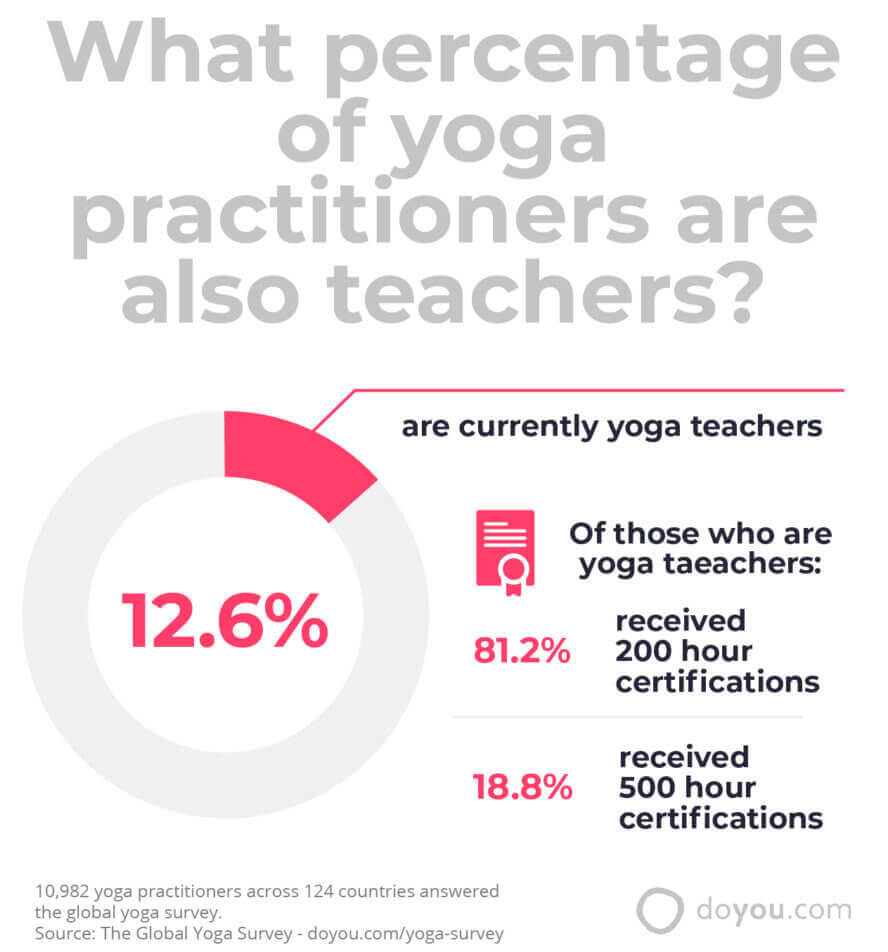
Key Finding #23: Over 1 in 10 Yoga Practitioners are currently Yoga Teachers, and 1 in 4 Yoga Practitioners Want to Become Yoga Teachers
Of those surveyed, 12.6% are currently yoga teachers. Of those who are yoga teachers, 81.2% received 200 hour certifications, and 18.8% received 500 hour certifications.
65.9% received their training locally, while 34.1% travelled for their training.
Additionally, the survey revealed that 5.2% yoga practitioners are currently training to become yoga teachers, and 24.0% have a desire to become yoga teachers.
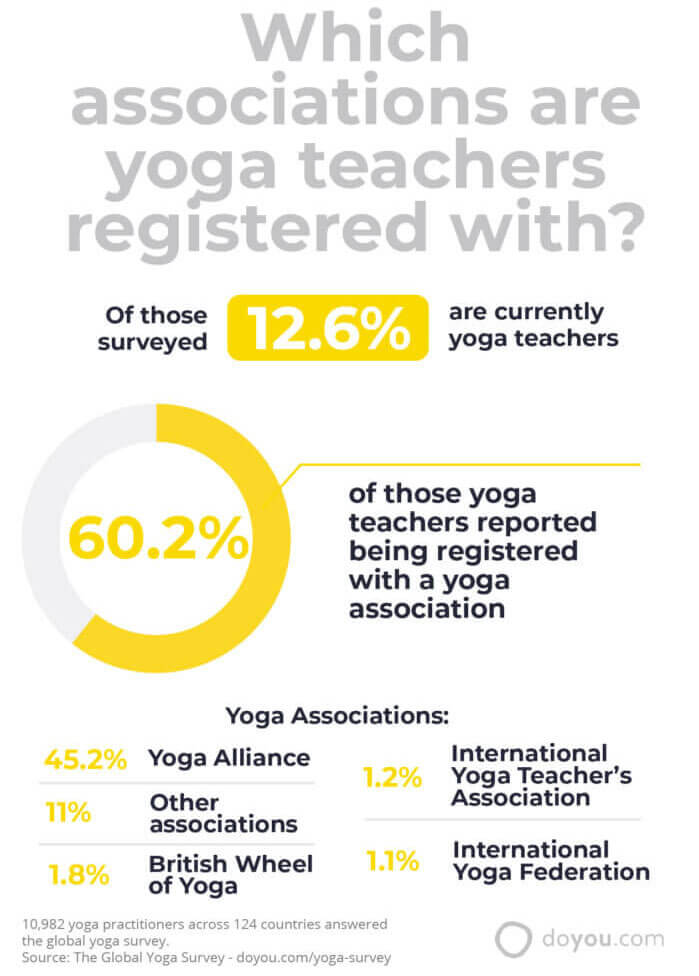
Key Finding #24: 6 in 10 Yoga Teachers are Registered With a Yoga Association
Yoga associations provide professional support and resources, additional training, and a level of professional validation. 60.2% of yoga teachers reported being registered with a yoga association.
Yoga Alliance was by far the most popular yoga association, with 45.2% of teachers reporting registration here. Additionally, 1.8% of yoga teachers are registered with the British Wheel of Yoga, 1.2% with the International Yoga Teachers Association, 1.1% with the International Yoga Federation, and 11.0% with other associations not listed.
Demographics of Respondents
In total, 10,982 people responded to the yoga survey. Below is a summary of the demographics of survey respondents:
Gender identity
- 87.7% female
- 11.3% male
- 0.4% other
- 0.6% preferred not to say
Country of origin
- 41.6% – United States
- 9.3% – Canada
- 8.1% – United Kingdom
- 3.8% – Australia
- 2.8% – Germany
- 2.1% – India
- 1.7% – The Netherlands
- 38.6% – Others
Age
- Average age of respondents were 32.5 years old.
- The age group most greatly represented in the survey were those between 25 and 34 (33.1%), followed by those who were between 34 and 44 (22.6%). However, people from all age groups, from under 18 to over 65, responded to the yoga survey.
About The Global Yoga Survey
DoYou has a large database of people who practice yoga around the world. We invited 10,982 DoYou users from 124 countries to respond to a 51-question survey about their yoga practice. The results were tabulated and analysed to identify 24 key findings.
About DoYou Media
DoYou is founded on the mission of building simple but effective tools that change people’s lives for the better. Our apps and platform are based on creating digital spaces that support people in building habits that improve their health. Learn more about us, our mission, and how to get involved here!
About Yoga Journal
Yoga Journal is an online resource that publishes expert content on yoga sequences and poses, meditation for yoga practitioners at all stages and information and guides on the yoga lifestyle.
About Yoga Alliance
Yoga Alliance is a non-profit association that supports high quality, diverse, safe, accessible, and equitable teaching of yoga. It has supported more than 100,000 Registered Yoga Teachers (RYT) as of April 2020.
Share the Global Yoga Survey
You are welcome to share this survey or any of the graphics. When you do, please make sure to include the following link: